10-27-06, Short ISRG, 30 min chart:

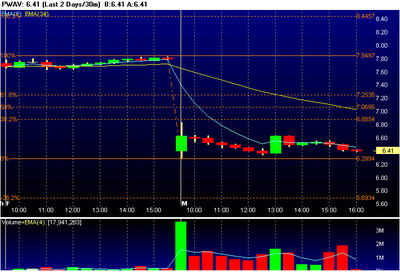
I went short at the green line ($100.09), as I saw it break below the opening range low and crack $100. There were lots of red flags on this one, but I chose a very aggressive stop anyway ($101.50) which made my reward:risk potential look really good (over 3). In retrospect, that stop was not justified since the entry was so far below the 5-ema, along with the wide range in the second bar. I jumped in on a quick down movement inside of the third bar, and ended up getting stopped out by the formation of the third bar hammer. I skipped down a timeframe and traded a 30-min setup on a 15-min chart and got nailed for -1R. I really need to stick to my timeframe instead of reacting to smaller order movements. If a trade doesn't work on your chosen timeframe and you have to jump down midway, then you've misread the risk:reward.

I went short at the green line ($100.09), as I saw it break below the opening range low and crack $100. There were lots of red flags on this one, but I chose a very aggressive stop anyway ($101.50) which made my reward:risk potential look really good (over 3). In retrospect, that stop was not justified since the entry was so far below the 5-ema, along with the wide range in the second bar. I jumped in on a quick down movement inside of the third bar, and ended up getting stopped out by the formation of the third bar hammer. I skipped down a timeframe and traded a 30-min setup on a 15-min chart and got nailed for -1R. I really need to stick to my timeframe instead of reacting to smaller order movements. If a trade doesn't work on your chosen timeframe and you have to jump down midway, then you've misread the risk:reward.


